
Dronika - environmental measurement software with reporting

Advanced air and water quality analysis software - Dronika system
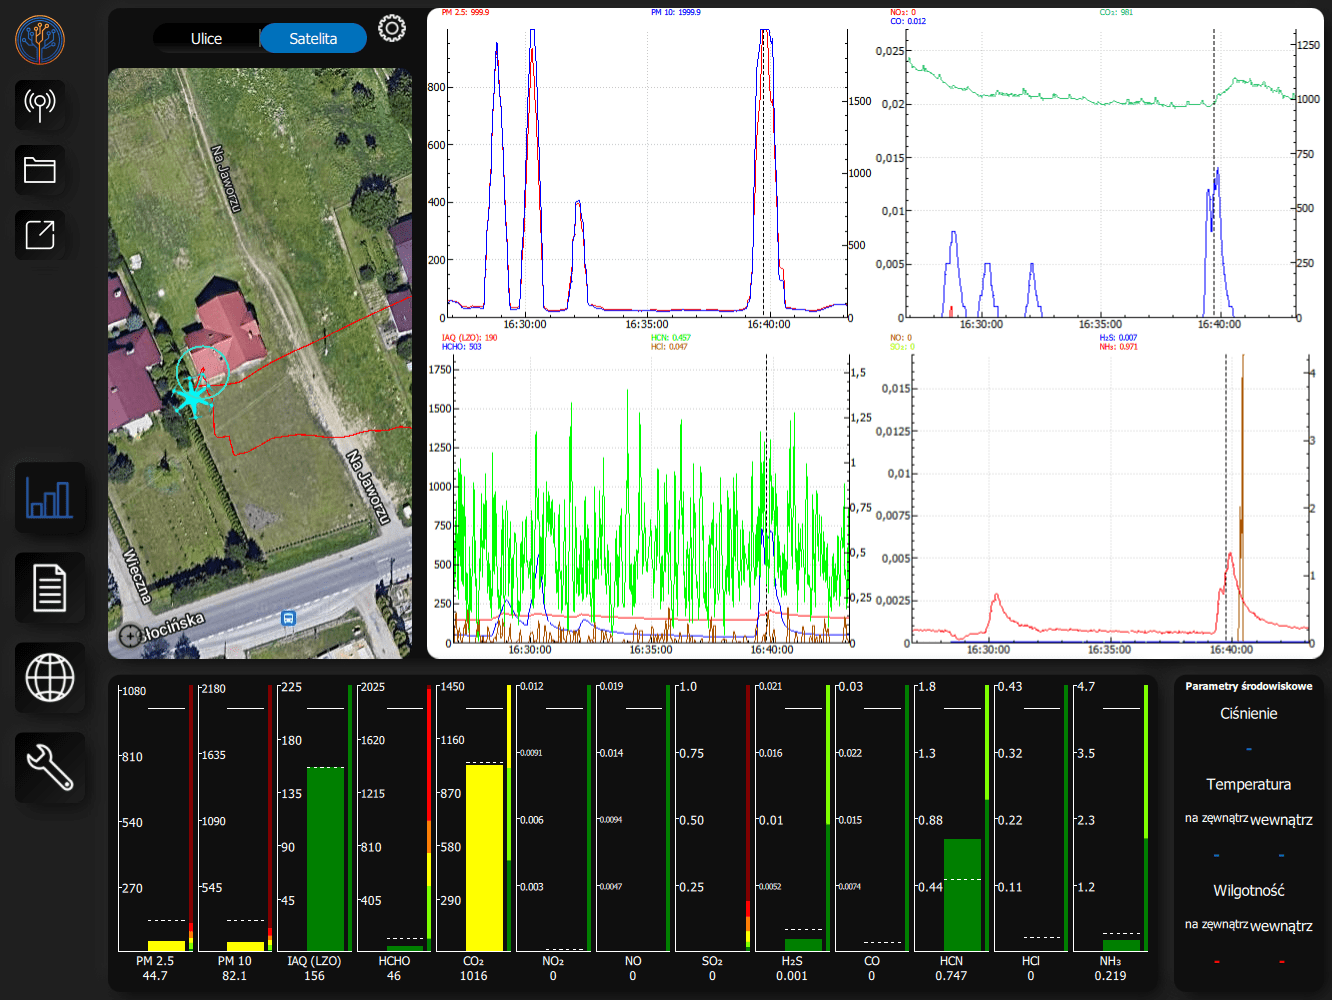
An integral part of Dronika system is our advanced software for Visualization and analysis of air and water quality measurements, which provides users with full control over real-time data. With interactive maps and dynamic bar and line graphs, users can instantly monitor the state of the environment and make decisions based on current measurement results.
Automatic location and timing of measurements
The software automatically marks the exact location of sampling, as well as the date and time of each measurement. This gives the user full access to precise information on the status of air and water quality in the selected area, which is invaluable for environmental activities, research or decision-making processes.
Flexible and intuitive interface
One of the biggest advantages of Dronik's software is its clear interface and high flexibility, which enable customization of functions. For example, in analyzing the degree of air pollution, the software uses data from the Polish Air Quality Index and standards WHO, but users can easily enter their own parameters and standards.
Advanced analysis and reporting
The software offers advanced reporting features, allowing users to choose the time range of measurements, how to present the results (maps, charts) and add their own comments and observations to the generated reports. Such flexibility makes the Dronika system ideal for both institutions monitoring environmental quality and individual users looking for precise analysis tools.
Dronik's main software features:
We are part of Drone Space Valley Read the rest Offers.
An integral part of Dronika system is our advanced software for Visualization and analysis of air and water quality measurements, which provides users with full control over real-time data. With interactive maps and dynamic bar and line graphs, users can instantly monitor the state of the environment and make decisions based on current measurement results.
Automatic location and timing of measurements
The software automatically marks the exact location of sampling, as well as the date and time of each measurement. This gives the user full access to precise information on the status of air and water quality in the selected area, which is invaluable for environmental activities, research or decision-making processes.
Flexible and intuitive interface
One of the biggest advantages of Dronik's software is its clear interface and high flexibility, which enable customization of functions. For example, in analyzing the degree of air pollution, the software uses data from the Polish Air Quality Index and standards WHO, but users can easily enter their own parameters and standards.
Advanced analysis and reporting
The software offers advanced reporting features, allowing users to choose the time range of measurements, how to present the results (maps, charts) and add their own comments and observations to the generated reports. Such flexibility makes the Dronika system ideal for both institutions monitoring environmental quality and individual users looking for precise analysis tools.
Dronik's main software features:
- Visualization of measurements: Maps, bar graphs and line graphs in real time.
- Automatic data tagging: Location, date and time of sampling.
- Flexible analysis options: Ability to enter custom values for norms and indices.
- Advanced reporting: Personalize reports, time range, how results are presented and add comments.
- Clear interface: Intuitive and easy to use even for less advanced users.
We are part of Drone Space Valley Read the rest Offers.